Useful for drawing the estimated regression function,
first and second derivative (for each factor's level). Additionally, with the
diffwith argument it is possible to draw the differences between
two factor's levels.
Usage
# S3 method for frfast
plot(
  x = model,
  y,
  fac = NULL,
  der = NULL,
  diffwith = NULL,
  points = TRUE,
  xlab = model$name[2],
  ylab = model$name[1],
  ylim = NULL,
  main = NULL,
  col = "black",
  CIcol = "black",
  pcol = "grey80",
  ablinecol = "red",
  abline = TRUE,
  type = "l",
  CItype = "l",
  lwd = 2,
  CIlwd = 1,
  lty = 1,
  CIlty = 2,
  cex = 0.6,
  ...
)
Arguments
- x
frfastobject.- y
NULL.
- fac
Vector which determines the level to take into account in the plot. By default is
NULL.- der
Number or vector which determines any inference process. By default
derisNULL. If this term is0, the plot shows the initial estimate. If it is1or2, it is designed for the first or second derivative, respectively.- diffwith
Factor's level used for drawing the differences respect to the level specified in the
facargument. By default,NULL. The differences are computed for the r-th derivative speciefied in thederargument.- points
Draw the original data into the plot. By default it is
TRUE.- xlab
A title for the
xaxis.- ylab
A title for the
yaxis.- ylim
The
ylimits of the plot.- main
An overall title for the plot.
- col
A specification for the default plotting color.
- CIcol
A specification for the default confidence intervals plotting color.
- pcol
A specification for the points color.
- ablinecol
The color to be used for
abline.- abline
Draw an horizontal line into the plot of the second derivative of the model.
- type
What type of plot should be drawn. Possible types are,
pfor points,lfor lines,ofor overplotted, etc. See details inpar.- CItype
What type of plot should be drawn for confidence intervals. Possible types are,
pfor points,lfor lines,ofor overplotted.- lwd
The line width, a positive number, defaulting to 1. See details in
par.- CIlwd
The line width for confidence intervals, a positive number, defaulting to 1.
- lty
The line type. Line types can either be specified as an integer (0 = blank, 1 = solid (default), 2 = dashed, 3 = dotted, 4 = dotdash, 5 = longdash, 6 = twodash). See details in
par.- CIlty
The line type for confidence intervals. Line types can either be specified as an integer (0 = blank, 1 = solid (default), 2 = dashed, 3 = dotted, 4 = dotdash, 5 = longdash, 6 = twodash).
- cex
A numerical value giving the amount by which plotting symbols should be magnified relative to the default. See details in
par.- ...
Other options.
Examples
library(npregfast)
data(barnacle)
# Nonparametric regression without interactions
fit <- frfast(DW ~ RC, data = barnacle, nboot = 100)
plot(fit)
 plot(fit, der = 0)
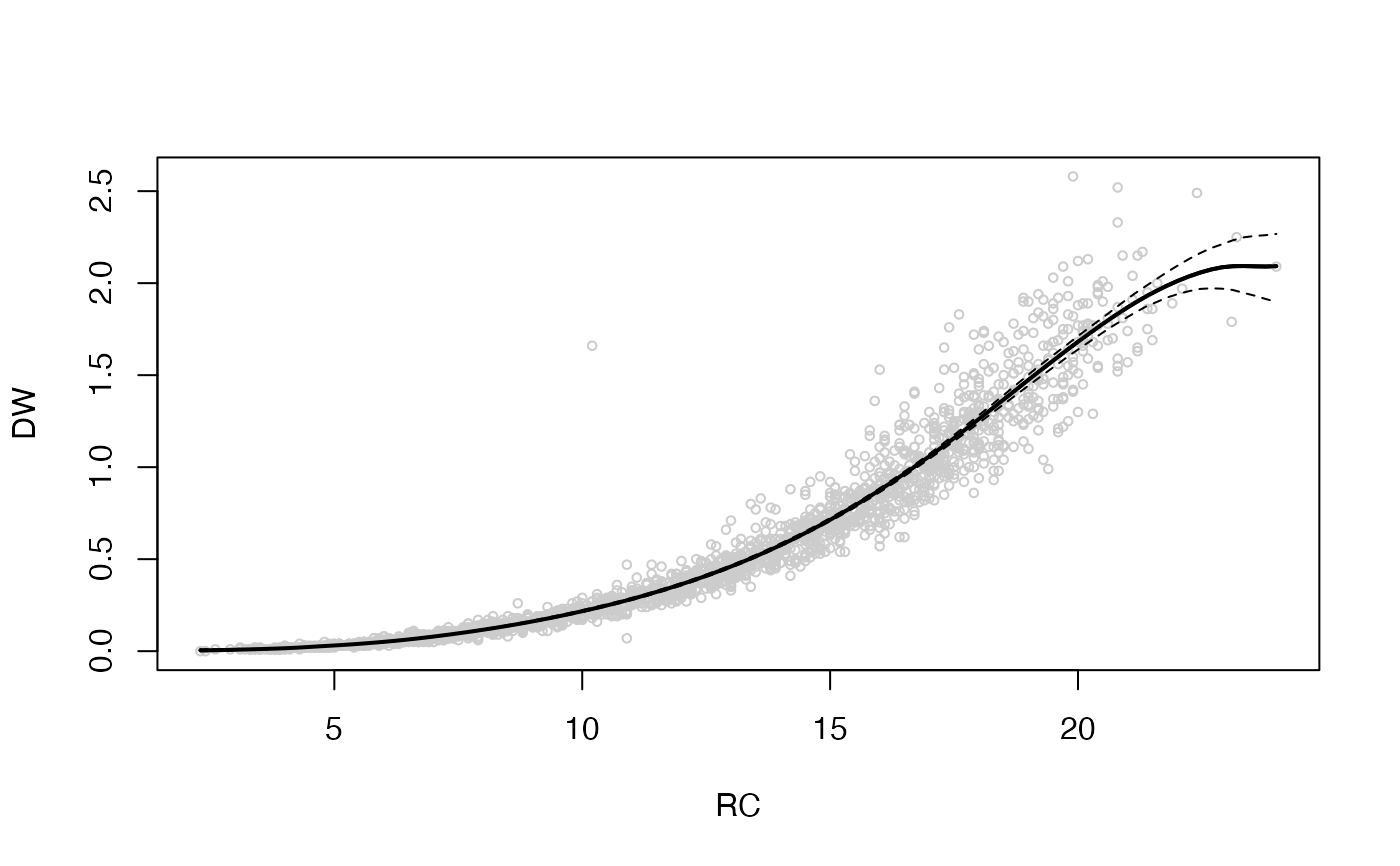 plot(fit, der = 0, points = FALSE)
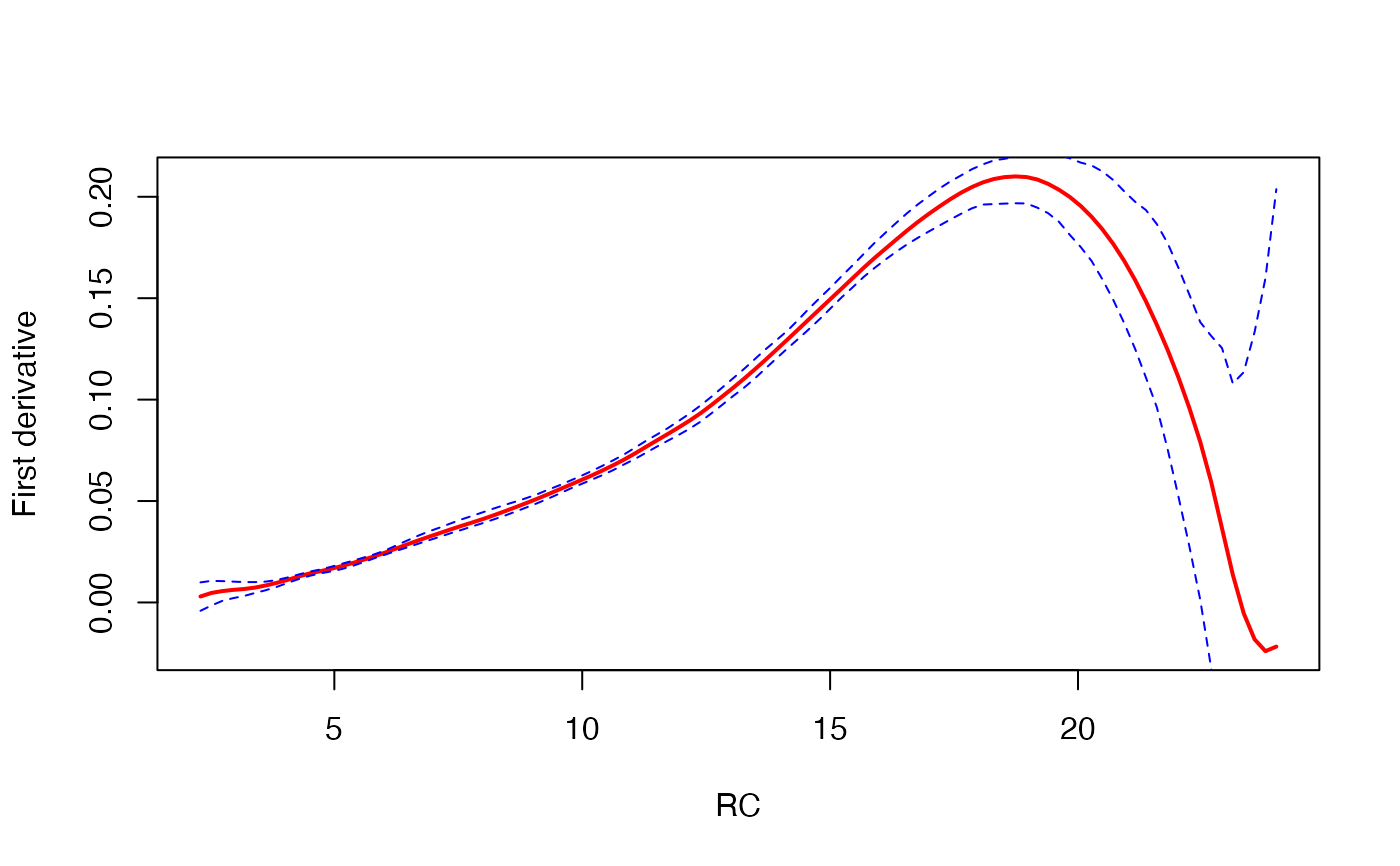
 plot(fit, der = 1, col = "red", CIcol = "blue")
 # Nonparametric regression with interactions
fit2 <- frfast(DW ~ RC : F, data = barnacle, nboot = 100)
plot(fit2)
# Nonparametric regression with interactions
fit2 <- frfast(DW ~ RC : F, data = barnacle, nboot = 100)
plot(fit2)
 plot(fit2, der = 0, fac = "lens")
 plot(fit2, der = 1, col = "grey", CIcol = "red")
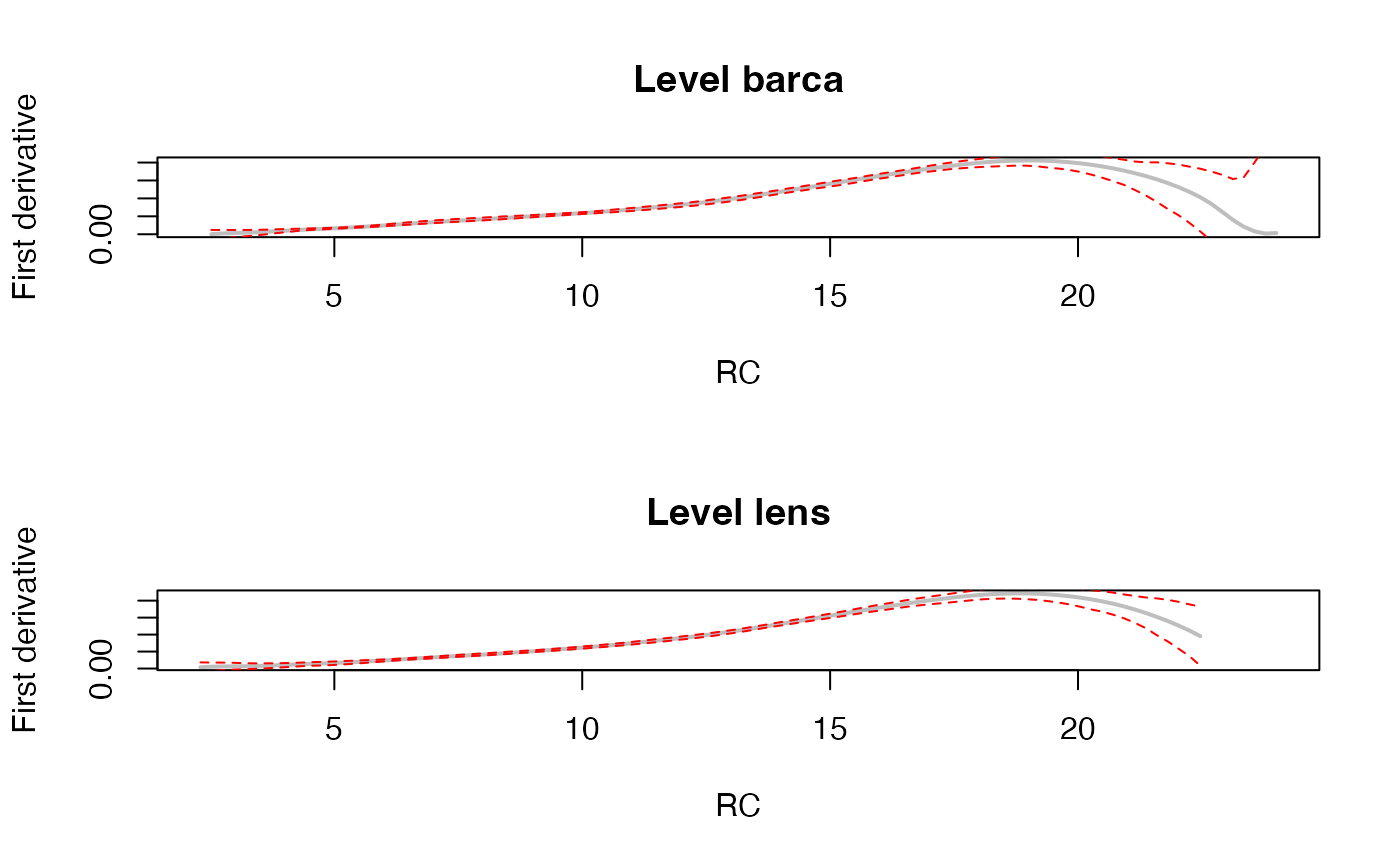 plot(fit2, der = c(0,1), fac = c("barca","lens"))
 # Visualization of the differences between two factor's levels
plot(fit2, fac = "barca", diffwith = "lens")
# Visualization of the differences between two factor's levels
plot(fit2, fac = "barca", diffwith = "lens")
 plot(fit2, fac = "barca", diffwith = "lens", der = 1)
